| Assumptions | MarketReality |
|---|---|
| A hard-landing for US economy is unlikely | Feeble July NFP |
| Bid Nvidia shares up 1,100% in less than 2 years | Weaker Big Tech’s quarterly earnings |
| Load up on junk loans bunded into bonds or borrow JPY and invest assets paying 11% in Mexico | BoJ hiked rates for the 2nd time this year |
What MSA is watching
The markets have seem to reached a consensus that the Fed will cut rates on Sep 18 yet they disagree with the magnitude of the cut. Recent remarks from Fed officials indicate that policymakers are aware of the risk from the job market but they may prefer a “slower to lower” approach considering the robustness of the US economy and the possibility of a hard landing. Some considered that a 50bps cut may be too hasty while others warn about the deterioration of the payrolls. UST market fluctuates around the short-end like 2yr which is largely impacted by FFR. US equity benchmarks lost winning streaks with the mega-caps suffered sharp decline.
- More updates to follow after Friday’s Jackson Hole speech by Powell.
Gone but not forgotten…
Global stocks selloff during the week of Aug 5: It’s a bit of JPY, a bit of fear of US recession, and a bit of summer madness
- unwinding JPY Carry Trade
- the great terror looms: fear of hard-landing for US economy
- crowded big-tech trade in the US
My two cents about the stock selloff on Aug 5:
If what my previous experience taught me about how the markets work makes sense, then here’s my two cents, I think Global Markets operate and trade on views, fueled by sentiments, and views result from assumptions.
The big take from this rout, is that there are 3 assumptions embedded so deep that they have been taken for granted by the markets practitioners for years - the key assumptions that investors across the globe were profiting from have been shaken.
In hindsight, we have: (1) the US economy is unstoppable; (2) AI will quickly revolutionize business everywhere; (3) Japan will never hike interest rates, or not enough to really matter. Indeed, they do sound too opportunistic.
Central Bank Watch
| CB | Decision | Date | Current | CCY | Next |
|---|---|---|---|---|---|
| Riksbank (SEK) | Aug 19 | 3.75% | SEK | ||
| Norges Bank (NOK) | Aug 15 | 4.5% | NOK | ||
| Banxico | -0.25% | Aug 08 | 10.75% | MXN | Sep 26 |
| RBA | unchanged | Aug 06 | 4.35% | AUD | Sep 24 |
| Bank of England | -0.25% | Aug 01 | 5.0% | GBP | Sep 19 |
| Federal Reserve | unchanged | July 31 | 5.5% | USD | Sep 18 |
| Bank of Japan | +0.25% | July 31 | 0.25% | JPY | Sep 20 |
| Bank of Canada | -0.25% | July 24 | 4.5% | CAD | Sep 04 |
| European Central Bank | unchanged | July 18 | 4.25% | EUR | Sep 12 |
Economic Data Watch
| Country | InterestRate | InflationRate | JoblessRate |
|---|---|---|---|
| 5.50 | 3.00 | 4.30 | |
| 4.50 | 2.70 | 6.40 | |
| 10.75 | 5.57 | 2.80 | |
| 3.35 | 0.50 | 5.00 | |
| 0.25 | 2.80 | 2.50 | |
| 4.25 | 2.60 | 6.50 | |
| 5.00 | 2.00 | 4.40 |
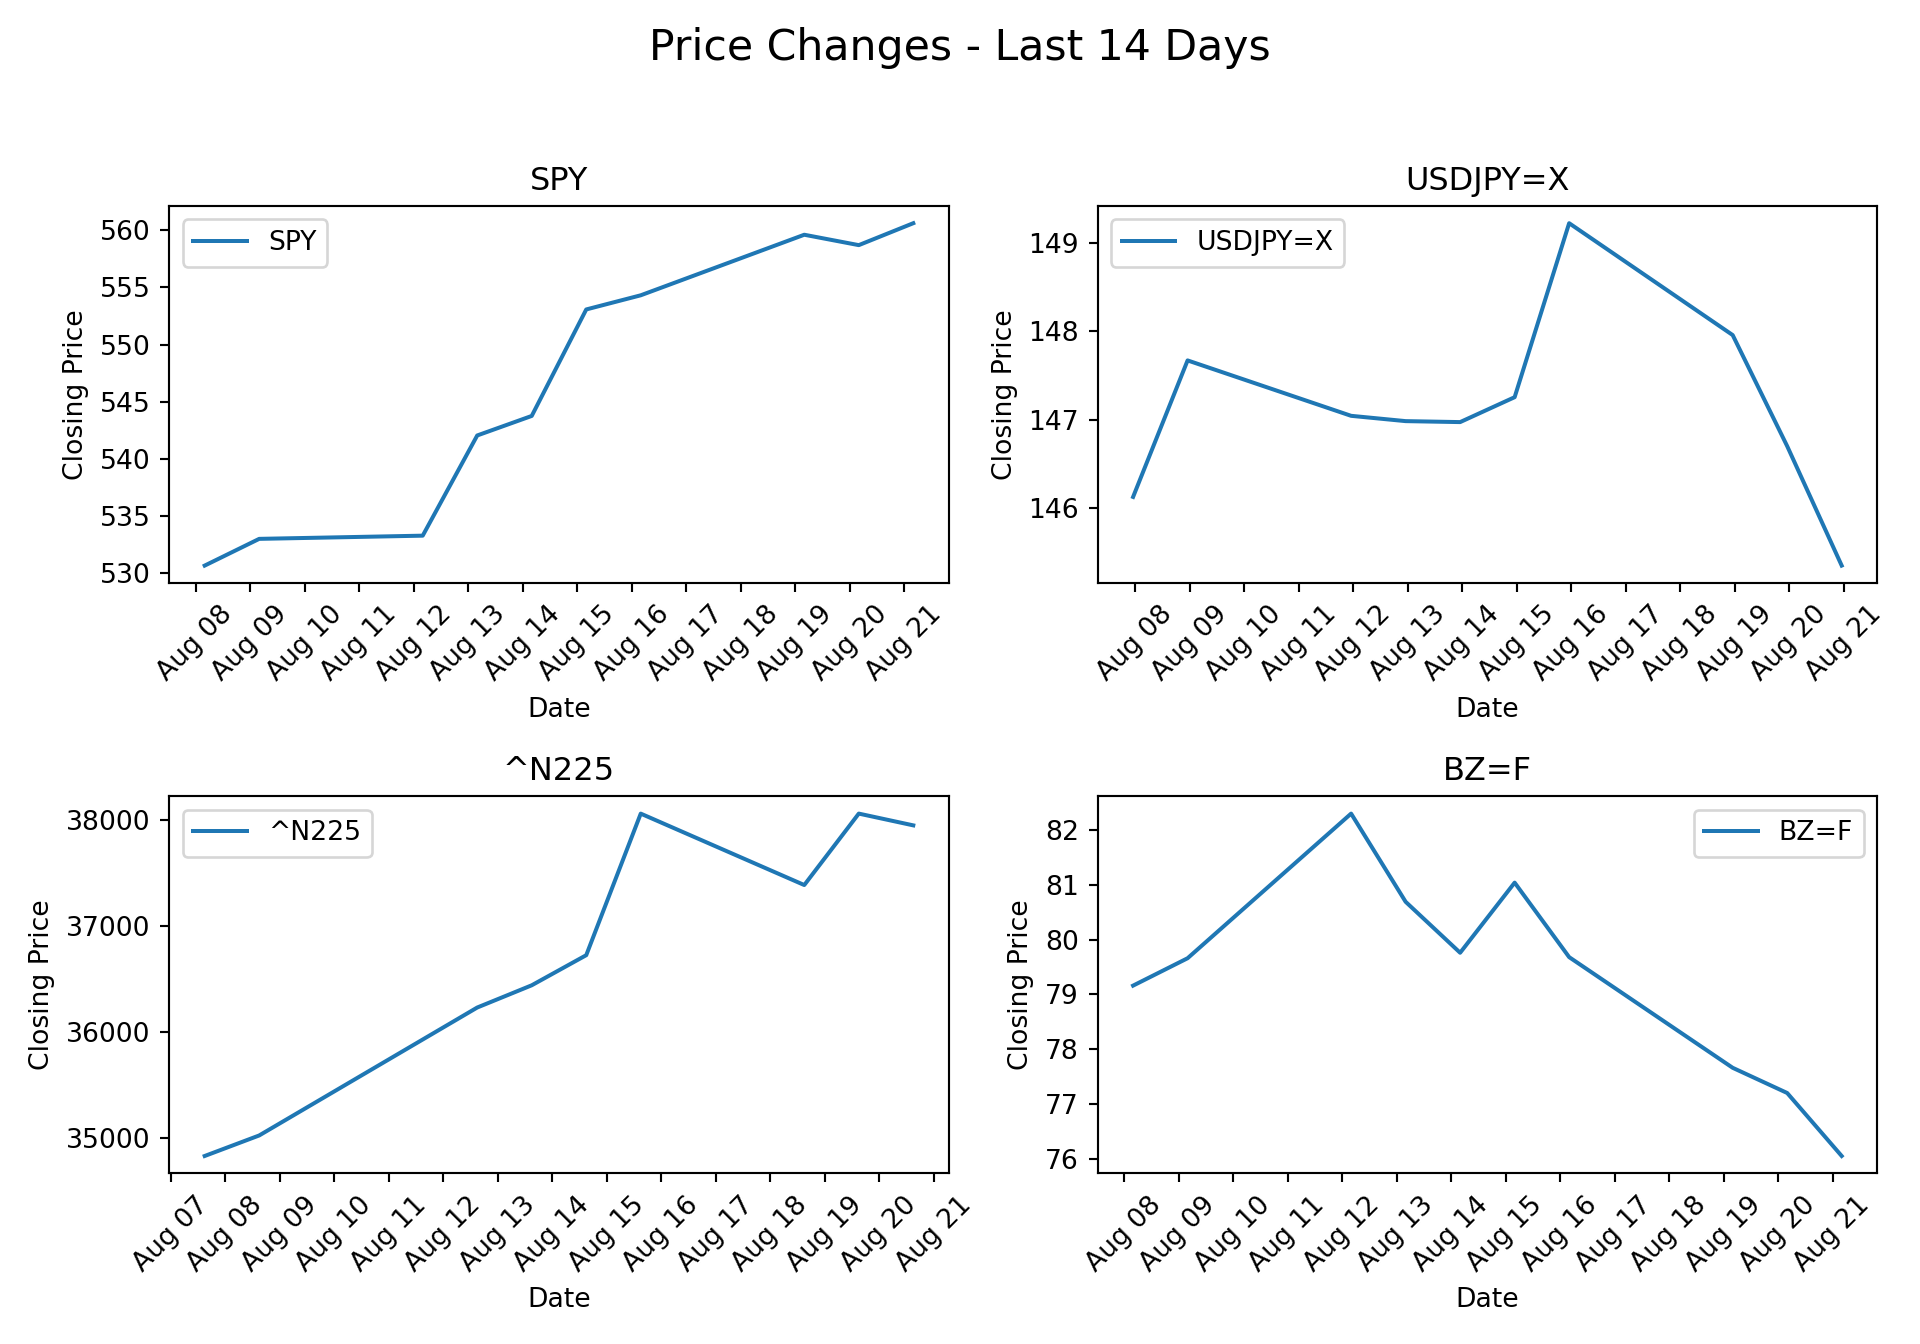
Market Data Watch
Note
This charting section is still in developing as the data server needs further calibration.
Code
import yfinance as yf/Users/nimbp21/.virtualenvs/r-reticulate/lib/python3.8/site-packages/urllib3/__init__.py:35: NotOpenSSLWarning: urllib3 v2 only supports OpenSSL 1.1.1+, currently the 'ssl' module is compiled with 'LibreSSL 2.8.3'. See: https://github.com/urllib3/urllib3/issues/3020
warnings.warn(Code
import matplotlib.pyplot as plt
import matplotlib.dates as mdates
from datetime import datetime, timedelta

# Set the today variable
today = datetime.today().date()
start_date = today - timedelta(days=14)

# List of tickers
tickers = ["SPY", "USDJPY=X", "^N225", "BZ=F"]

# Create a figure and a set of subplots
fig, axs = plt.subplots(2, 2, figsize=(10, 7))
fig.suptitle('Price Changes - Last 14 Days', fontsize=16)

for ax, ticker in zip(axs.flat, tickers):
    # Fetch data
    try:
        data = yf.Ticker(ticker).history(start=start_date, end=today)
        if data.empty:
            ax.text(0.5, 0.5, f'No data for {ticker}', ha='center', va='center')
            ax.set_title(ticker)
        else:
            # Plot the closing price
            ax.plot(data.index, data['Close'], label=ticker)
            # Customize the date format on the x-axis
            ax.xaxis.set_major_formatter(mdates.DateFormatter('%b %d'))
            ax.xaxis.set_major_locator(mdates.DayLocator())
            ax.set_xlabel('Date')
            ax.set_ylabel('Closing Price')
            ax.set_title(ticker)
            ax.legend()
            ax.grid(False)
            ax.tick_params(axis='x', rotation=45)  # Rotate dates for better readability
    except Exception as e:
        ax.text(0.5, 0.5, f'Error loading data\n{e}', ha='center', va='center')
        ax.set_title(ticker)

# Adjust layout to prevent clipping
plt.tight_layout(rect=[0, 0, 1, 0.95])
plt.show()